4 Must-have Data Points for Dispatch-Billing Alignment and Maximum Reimbursement
Road Safety Enhancements Provide Greater Insight into Ambulance Safety
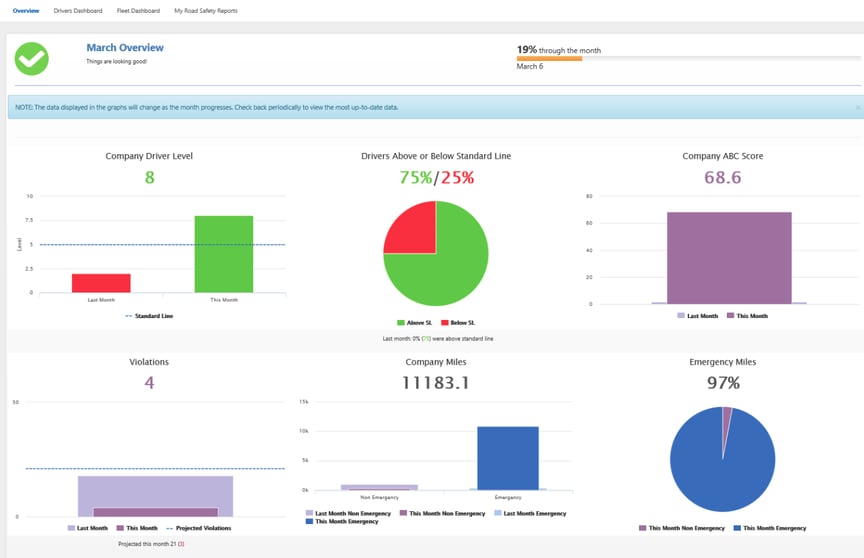
In the April release of ZOLL Online, we’re introducing the new Road Safety Overview dashboard and an improved reporting experience
Was this information valuable?

In the April release of ZOLL Online, we’re introducing the new Road Safety Overview dashboard and an improved reporting experience. These enhancements will provide greater insight into your agency’s ambulance safety and enable you to quickly make more impactful decisions, ultimately making your organization safer.
Identify Safety TrendsThe overview dashboard provides insight into your agency’s safety performance trend – from an overall organization down to a driver level point of view. For example, is your company’s overall safety grade (ABC score) trending positive, negative or flat? Or, is the percentage of drivers below the standard line trending positive, negative or flat?
A positive trend indicates that the safety program and procedures in place are having a positive impact on your company. A downward trend indicates that improvement is needed and signals you to drill into your data to gain a deeper understanding of actions needing to be taken.

Drill into the Red
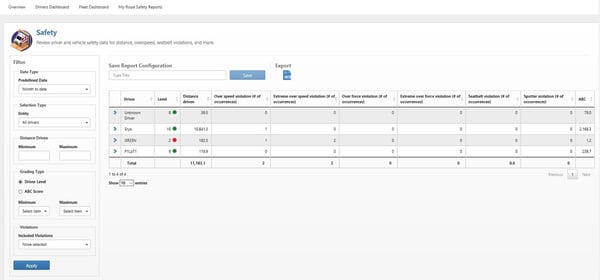
The improved filtering capability allows you to quickly understand the aspects of your organization that are contributing to a downward trend in safety – and exposing your agency to its greatest liability. Data can be sorted by distance driven ranges, driver level, ABC scores and to include specific violation types. By drilling down to specific information around a risky set of drivers or behaviors, you can answer questions such as:
- Have the drivers “in the red” been properly trained?
- Are these risky drivers new or seasoned? If new, have they been properly trained on the Road Safety system? If seasoned, does the current onboarding process need to be reworked? Does past safety data support additional training or potential termination?
- Have the Road Safety systems been inspected for system calibration, disconnected speakers, etc.?

Improve Safety Training & Internal Processes with Hard Data
Leverage the Road Safety data to identify where your risks are the greatest. Use this data to prioritize your efforts and focus on the areas that are exposing your agency to the greatest risk and liability.
- Are specific crew members driving more aggressively or are there other factors needing investigation? Where are violations coming from? Are they emergency versus transport calls? Are they occurring in urban versus rural territory?
- What type of violations are most common (speeding, aggressive turning/braking, lack of seat belt or back-up spotter use)?
- Are lights and sirens being used properly and in compliance with company policies?
- Are there more violations in a certain part of the service territory?
By focusing your time and energy on the high safety risk areas of your organization, you will be able to more efficiently use your resources to improve safety. The ability to monitor and change driver behavior is critical to creating and maintaining a sustainable culture of safety throughout your EMS organization.
Related Posts
How EMS Agencies Can Reframe Need and Refocus Resources With Geospatial Analytics
How To Minimize Radio Chatter and Reduce Guesswork With Smarter Dispatch Resource Management
ZOLL Pulse Blog
Subscribe to our blog and receive quality content that makes your job as an EMS & fire, hospital, or AR professional easier.
ZOLL Pulse Blog
Subscribe to our blog and receive quality content that makes your job as an EMS, fire, hospital, or AR professional easier.


