4 Must-have Data Points for Dispatch-Billing Alignment and Maximum Reimbursement
How to Use GIS to Improve Billing, Operations & Responder Safety
Have you ever tried to geocode an incident for a motor vehicle crash using a milepost on a roadway or determine the best access point to a limited-access highway quickly and accurately? Arguably accuracy and speed are equally as important during incident creation
Was this information valuable?

Have you ever tried to geocode an incident for a motor vehicle crash using a milepost on a roadway or determine the best access point to a limited-access highway quickly and accurately? Arguably accuracy and speed are equally as important during incident creation. Are your billers cross-referencing a massive list of zip codes to a table of Geographic Practice Cost Index (GPCI) locals for proper charge selection during claim creation? Are your CAD operators looking at too many calls and units on their screens?
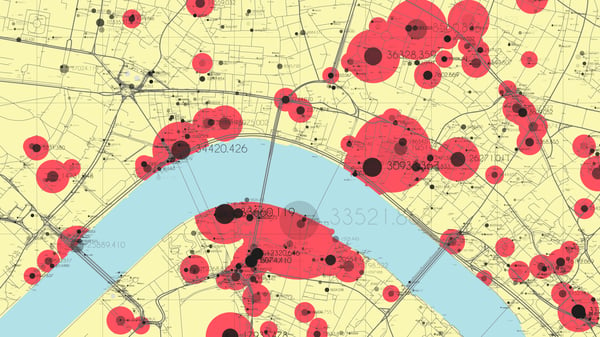
Graphical Information Systems (GIS) are common in today’s modern CAD systems. These systems contain layers of visual data (map data) placed on a standard coordinate system that can provide answers and efficient solutions to these questions. ZOLL’s RescueNet Suite has this sophisticated GIS capability, and has for decades. Because most people are intimidated by GIS technology, the following blog post breaks down:
- GIS basics for EMS
- Technical aspects for GIS
- How ZOLL billing and dispatch software use GIS
GIS Basics for EMS
Think of GIS layers in simple terms. Visualize a piece of plain quadrille-ruled white paper (8.5 x 11) and draw an outline of a single family home and property outline as the base layer. The quadrille paper grid will represent the coordinate system. Now visualize several pieces if 8.5 x 11 clear film that will be overlaid on top of the paper representing different themes to the home such as outdoor gardens, sprinkler head placement, patio furniture, first floor, second floor, etc.
Each one can be drawn with respect to the same relative coordinate system. The film layers can be overlaid in multiples or one at a time depending on the need of the designer. This would enable the designer to visualize different themes in relation to others while allowing the designer to make adjustments to each theme independently. As layers and objects may overlap each other such as the second floor on top of the first floor, careful selection of color and brightness will produce layer transparency.
This is the same methodology is applied in many GIS systems. CAD systems commonly refer to these layers as shapefiles” and contain the file extension “.shp”. There are more data files that comprise a full GIS “layer” (such as *.dbf, *.shx, etc.). I will not get into those confusing details in this blog.
Technical Aspects of GIS
There are a variety of commercial GIS companies. Autodesk, Bentley, ENVI, Intergraph, MapInfo, and ESRI are among a few commonly known. ZOLL uses ESRI GIS files in RescueNet Dispatch/Billing. Standard shapefiles include highways, streets, streams, water, rail way, parks, exits, urban, airports, counties, states, zip codes among the most commonly viewed. These shape files can be turned on and off visually as needed for CAD users.
When an address is geocoded the result is two data points: an X and a Y (i.e. GPS coordinates, latitude/longitude). The process of geocoding is nothing more than a cross-reference lookup of these XY coordinates against a table of street names, block numbers and subdivisions. Subdivision examples are zip code names, municipality names and urban area names depending on the database provided (Geobase).
The base grid these maps use is the GPS. Think of the GPS grid as the quadrille-ruled paper in the earlier example. Each square on the paper represents a unique XY pairing to identify an exact location on the paper. The same holds true for the GPS grid system. Smart phones and other GPS-enabled devices use map data (Google, Apple, Waze, Sygic, TomTom, Garmin, etc.) that use this same grid system.
How ZOLL Billing & Dispatch Software Leverage GIS
Custom shapefiles included in ZOLL’s software package are Billing Zones, Dispatch Zones, Response Zones and Map Page. These specific empty GIS files provide more than just visual reference on a map in the ZOLL Database. The following are examples of how users manipulate and deploy these zones for specific use and functionality.
Billing Zones can be created to identify a Center for Medicare and Medicaid Services (CMS) Locality. This is an extremely accurate and efficient tool that determines the locality transport origin within a carrier’s jurisdiction. It helps determine expected reimbursement rates based on the GPCI in the Medicare Fee Schedule. CMS maps zip codes to geographic localities. Instead of looking up a zip code manually to determine the proper local, create a billing zone layer (clear film) that combines all the zip codes for each carrier local. As addresses are geocoded (by street or zip code override) the billing zone will automatically be selected (Tab 3 of the Call Taking Module). Combinations of charges, call types, priorities and billing zones within RescueNet Dispatch and Billing Administration will automatically select the appropriate default charges for each combination.

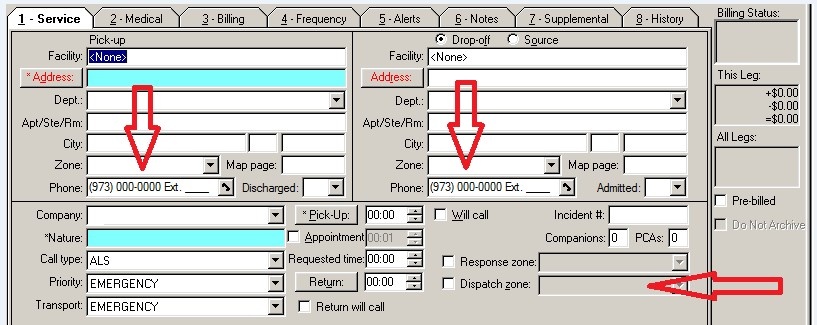
Dispatch Zones geographically filter out units and calls to reduce the “white noise” dispatchers see because of Open Work and Units/Vehicles for which they have no responsibility. These geographic zones can be anything including groups of zip codes, municipalities, counties, states, etc. Using GIS software such as ArcGIS zones can be cut, spliced, cross-sectioned, merged or kept intact. This is where the specific needs of the CAD operators are considered during design. These dispatch zones are found all over the ZOLL Call Taking module, including the Origin (pick-up zone), Destination (drop-off zone), Customer Record (Home Zone), Vehicles and Facilities.

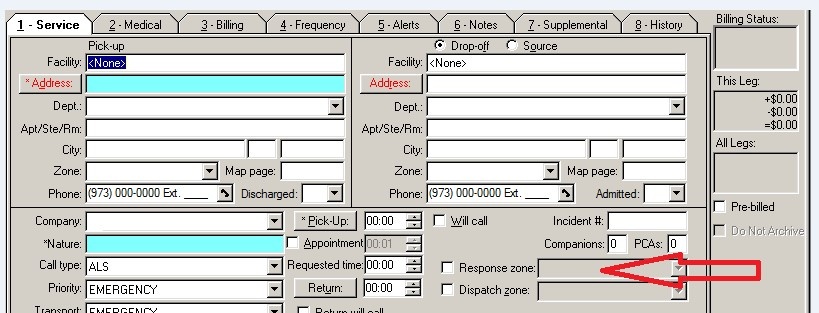
Response Zones were added to the RescueNet Dispatch and Billing system to allow high-performing EMS systems to build and analyze geographic areas of incident locations. Functionality was added to the overdue checking feature to allow response-zone related profiles to be configured. Reports and Analytics can also be designed and monitored relating to Response Zones. The Response Zone field is found on Tab 1 of Call Taking near the “Save” button.

Getting Prolific
Creative Map Layers can contain anything imaginable that can be associated and anchored to an XY coordinate (and placed on its own clear piece of film). Examples of these layers include mile markers/posts, limited access highway entry/egress, fire hydrants, beach access points, landmarks without an address, etc. One recent example of a Map Layer I created for a 911 provider in New Jersey was the state-wide milepost system. This data was available on the state GIS website. I downloaded the data files containing every mile post name and XY along with the roadway name contained in the database and created a Milepost Map Layer using ArcGIS Software. This layer enables CAD operators to search for a highway name and mile post using the ZOLL CAD Map, zoom into the map close enough to create an incident on the map specific to the reported direction of travel (North Bound, South Bound, etc.), which provides an extremely accurate location on the highway (within tenths of miles).
The CADGIS module from Dispatch Pro provides the operator with the most accurate ETAs and distances in candidate rankings based on the access to the roadway’s incident. This is extremely helpful for limited access highways. Best practices in modern public-safety highway responses suggest not using emergency turnarounds or operating from the opposite direction of a divided highway. Using this method and tools, the CAD operators are able to select the safest most appropriate unit for response.
- Are your dispatchers seeing units and calls outside of their geographic area? Would you like to reduce this white noise around their area of responsibility?
- Are your billers using a cross-reference table of zip codes to carrier local and manually adding base rate charges for Medicare? Would you like the charges to drop automatically based on the carrier local and zip code?
- Are your call-takers unable to geocode milepost incidents? Would you like them to zoom to the milepost in the direction of travel and create an accurate incident based on latitude/longitude?
- Do you need to produce metrics on municipalities or Minor Civil Divisions (MCD)?
If you answered yes to any of these, then your service can benefit from the Zones Module within RescueNet Dispatch/Billing. If you have the module and need assistance creating or modifying zones or shapefiles you can reach out to ZOLL Custom Solutions or YTT Consulting.
Related Posts
Podcast: 4 Ways ePCR Software Can Relieve EMS’ Biggest Headaches
How EMS Agencies Can Reframe Need and Refocus Resources With Geospatial Analytics
ZOLL Pulse Blog
Subscribe to our blog and receive quality content that makes your job as an EMS & fire, hospital, or AR professional easier.
ZOLL Pulse Blog
Subscribe to our blog and receive quality content that makes your job as an EMS, fire, hospital, or AR professional easier.


